

The post Cup and Handle Pattern Suggests another Dip in Bitcoin appeared first on Coinpedia Fintech News
Bitcoin has been trying to come over the $70,000 price mark for many days now. Everytime it comes near its target, something new fills the market with fear and BTC fails the mission. It now feels like a video game where you almost killed the boss but misses with little chance left. Let’s explore what technical analysis of Bitcoin has to say.
Bitcoin Displays Cup and Handle Pattern
The weekly chart of Bitcoin displays a cup and handle pattern. This pattern reflects the continuation to an uptrend once the handle is fully formed. Looking at the chart, it looks like the pattern is about to finish, which means the rise in price is on its way. However, it is quite possible we see a little pull back before Bitcoin starts its journey to create another All Time High.
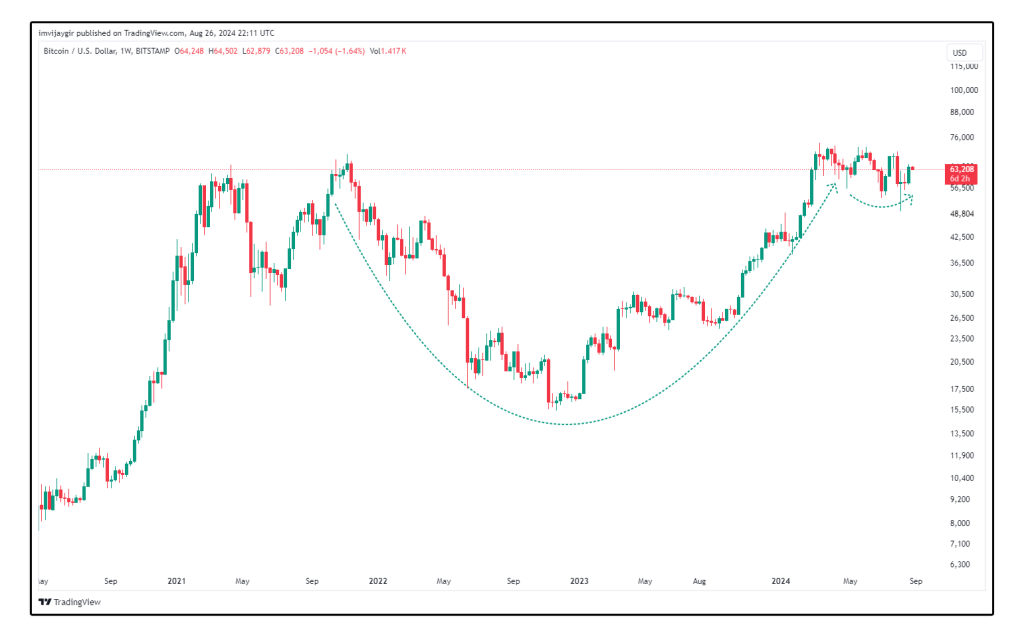
As of writing, Bitcoin price shows a decline of 1.77% from its previous day and is moving near $63,093. The latest major support can be seen at around $61,693 which means we can see another 2.24% drop in price. Just two days back, Bitcoin received a 7.79% rise in price and reached a height of $64,988 before finally closing at $ 64,085
Multiple Signals in Daily Chart
The daily Bitcoin chart looks more interesting than the weekly chart. Here, we can see multiple indicators that are pointing towards a rise in the near future. There is however, a negative factor, signaling at pattern failure as well.
Since March this year to the current time, the movement of Bitcoin created a falling channel pattern. This pattern along with the indications from MACD signals an upcoming price soar.
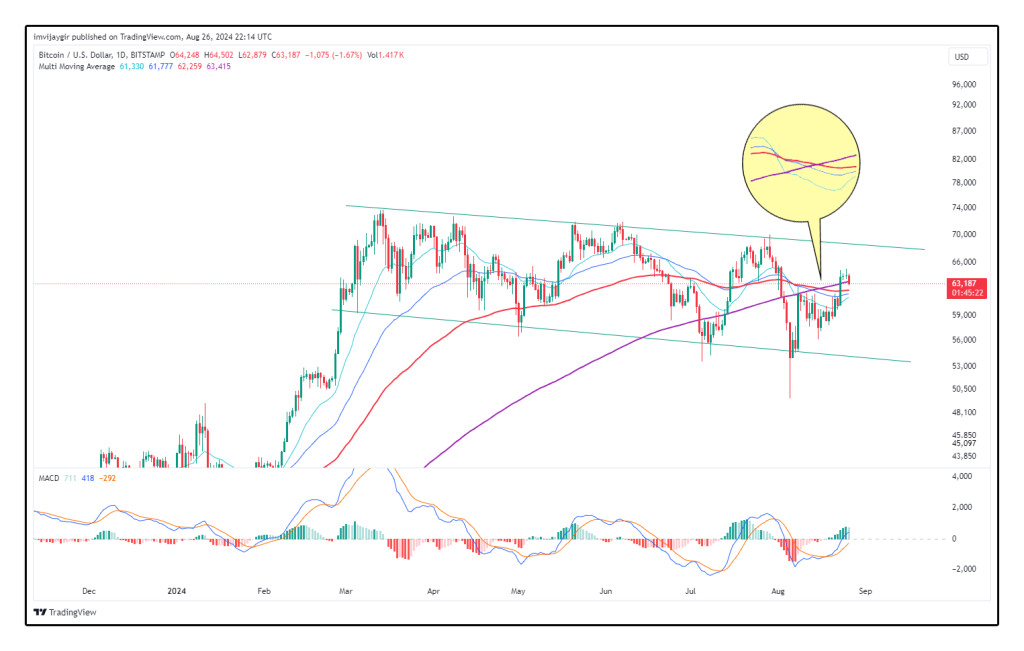
One thing that gives a negative signal is the death cross. The 200 Moving average crossing above all other MAs, including 50 supports the idea of seeing a pullback. Apart from this everything is bullish. This includes the crossover of the MACD line over the Signal line. The rise in green on the Bitcoin charts gives us the hope to stay strong and that the wait is almost over.
Looking Ahead
Most of the signals are pointing to one direction that we are going to see a great rise in the price of Bitcoin soon. August and September have been bearish months for Bitcoin historically. But it looks like BTC is going to change this time. However, traders should not put down their shield as such bullish sentiment can hurt badly when the market goes south.