The post DOT Price Analysis: Back At The Base, Will DOT Price Reverse To Reach Breakout Velocity? appeared first on Coinpedia Fintech News
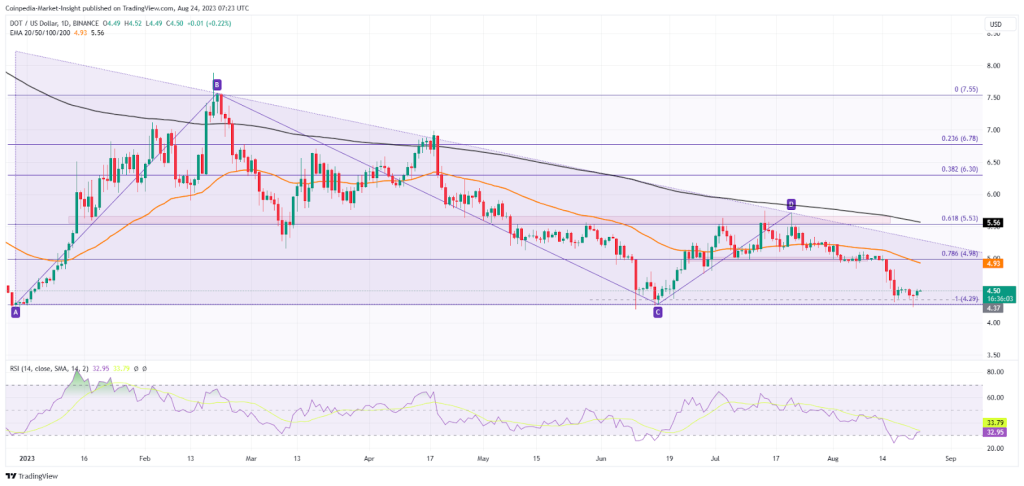
With the declining , DOT price falls drastically to form a descending triangle pattern in the 1-day chart. The minimal YTD growth in Polkadot is a result of this triangle pattern.
The solid use case and development activities, with USD Coin from Circle soon to be available on Polkadot project a bullish future.
Following the consolidation between $4.98 and $5.53, the DOT price action gives a bearish breakout to test the $4.29 mark. The plunge completes the negative cycle within the triangle and brings the possibility of a bullish reversal.

Supporting the bullish thesis, the DOT price action forms a double bottom pattern at $4.29 with strong lower price rejections. Moreover, the $4.29 support level has been critical in 2023 to provide crucial bounce backs and absorb the spike in supply inflow.
Sharing a similar picture to the rest of the market, the daily RSI line displays a bullish divergence. However, the declining EMAs will prove to be an obstacle in the recovery rally.
Despite a single-digit YTD growth, Polkadot sets a bullish launch to launch a moonshot. The positive cycle can rechallenge the overhead resistance trendline slightly above $5.
Optimistically, if the reversal rally breaks above the triangle, the DOT price can jump to $6.30.
On the flip side, a bearish breakdown of $4.29 will plunge the DOT price to $2.27.


