


The post Ripple Jumped 48% in 2 Days: Could $10 Be Next for XRP? appeared first on Coinpedia Fintech News
Ripple’s price has been rising continuously for the past two days, bringing joy to the crypto community. It now seems like the downtrend that started on March 12 for XRP might be ending. In the past two days, XRP’s price has increased by 48%. At the time of writing, Ripple is trading at $0.58209.
Historical Importance For Ripple
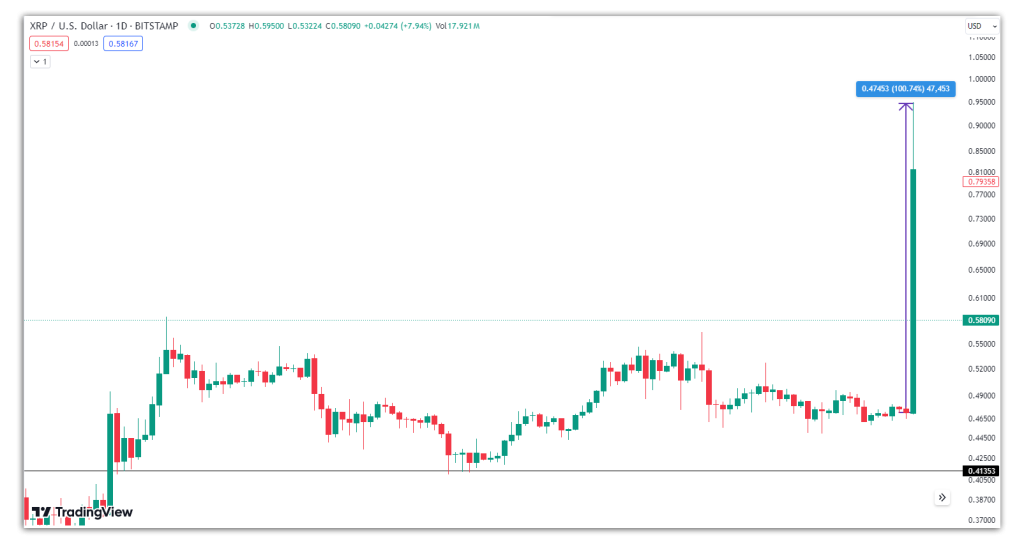
In December 2020, the SEC filed a lawsuit against Ripple Labs, claiming that XRP was an unregistered security. On July 13 last year, Ripple won a significant victory when the court ruled that XRP is not a security. Historical data shows that after this ruling, the XRP token jumped by 100%. Moreover, on the anniversary of this ruling, this coin has again received a boost rising by 48%.
Technical Analysis Supports Positive Sentiment
Technical indicators also show a bullish sentiment for XRP. The MACD indicator shows the MACD line crossing the signal line at 0.01284, while the signal line is at -0.00281. If this prediction becomes true, it suggests XRP’s bullish trend soon.
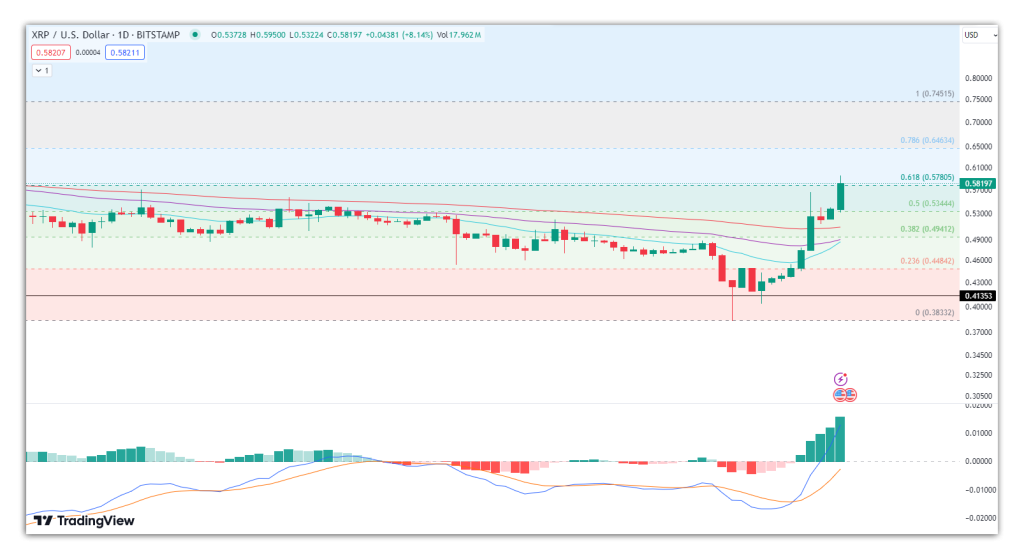
As per the chart all moving averages are acting as support and holding the price steady. On the FIB chart, XRP’s price has crossed multiple resistances.
Let’s understand the zones here! The support resistance channel shows that XRP’s latest support is in the $0.54900 – $0.55800 zone, with a major resistance at $0.65. If XRP crosses this resistance, it could continue its climb towards $1.
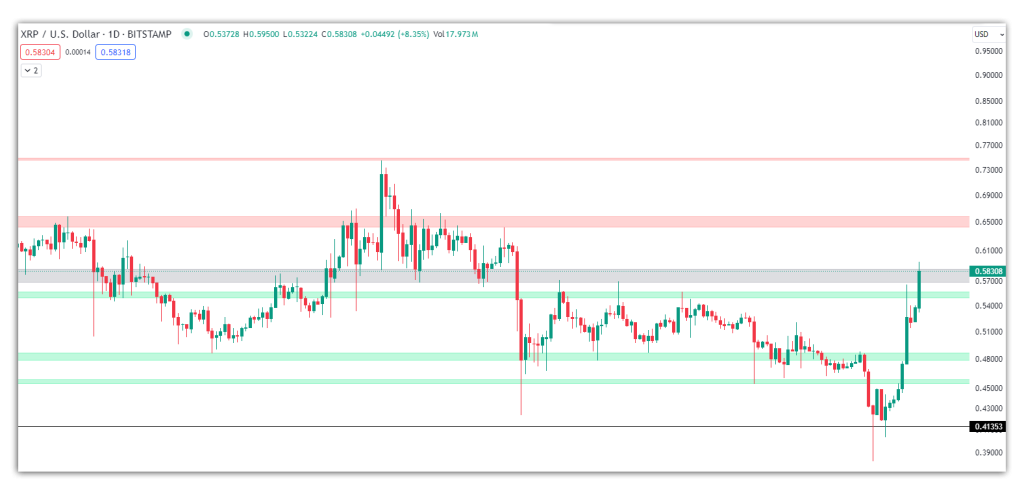
One important point here is, the weekly chart indicates that if XRP crosses $0.65 in the next few days, it will return to an uptrend and gain support from the weekly trend line.
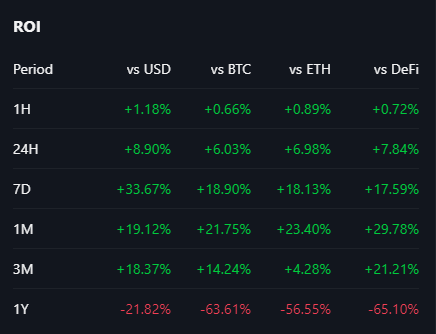
Data from Messari shows that XRP has been a profitable asset over the past year. From its lowest point during the downtrend at $0.122 (March 13, 2020), it has risen by 377.56%. However, it is still 82.28% below its all-time high price of $3.29 (January 4, 2018).
Market intelligence platform Santiment shared a tweet showing the accumulation zone of XRP whales, stating that whales are supporting this price surge.
XRP has now climbed above $0.58 for the first time since the market-wide retrace back on April 12th. This rebound is supported by climbing levels of coin hodling from whales and sharks with 100K+ XRP coins. A noticable turning point in supply accumulation began last August. pic.twitter.com/nBNsAfnoiw
— Santiment (@santimentfeed) July 16, 2024

Closing Thoughts
At this moment, all indicators from charts and the on chain data support XRP’s price surge but the crypto community is waiting for Ripple’s victory in the SEC case. Experts believe that once Ripple overcomes this lawsuit, nothing can stop it from reaching $10. Additionally, many institutions might start accepting Ripple, and after the Solana ETF, we could also see a Ripple ETF..