


The post Today’s Top Gainers: QNT, MOG, POPCAT Take the Spotlight appeared first on Coinpedia Fintech News
The crypto market in June has been a tug-of-war between Bulls and Bears. Bitcoin making runs between $60K and $62K, Ethereum’s price is on a downtrend, and other altcoins show mixed signals. As we finally see a positive momentum rising, here are some resilient top gainers that have the spotlight of today.
Quant, QNT: Weak Trend, Pullback Possible
Quant in the last 30 days frame has been in a downtrend, traveling from $92 at the start of the month to the low at $70. But yesterday QNT behaved strongly and shot upward to come out of the bullish trend.
At press time, QNT is at $77.45 with a 24-hour bounce of 10.03%, for the QNT holders this is a ray of hope to breach above the critical $80 to rally further.
A large whale sell-off of 119,000 QNT was registered on 28 June, which slummed the price down to a low of $70, but bulls managed to pull back the trend. Most of the QNT holders are in red now, since the asset took a narrow route since March end.
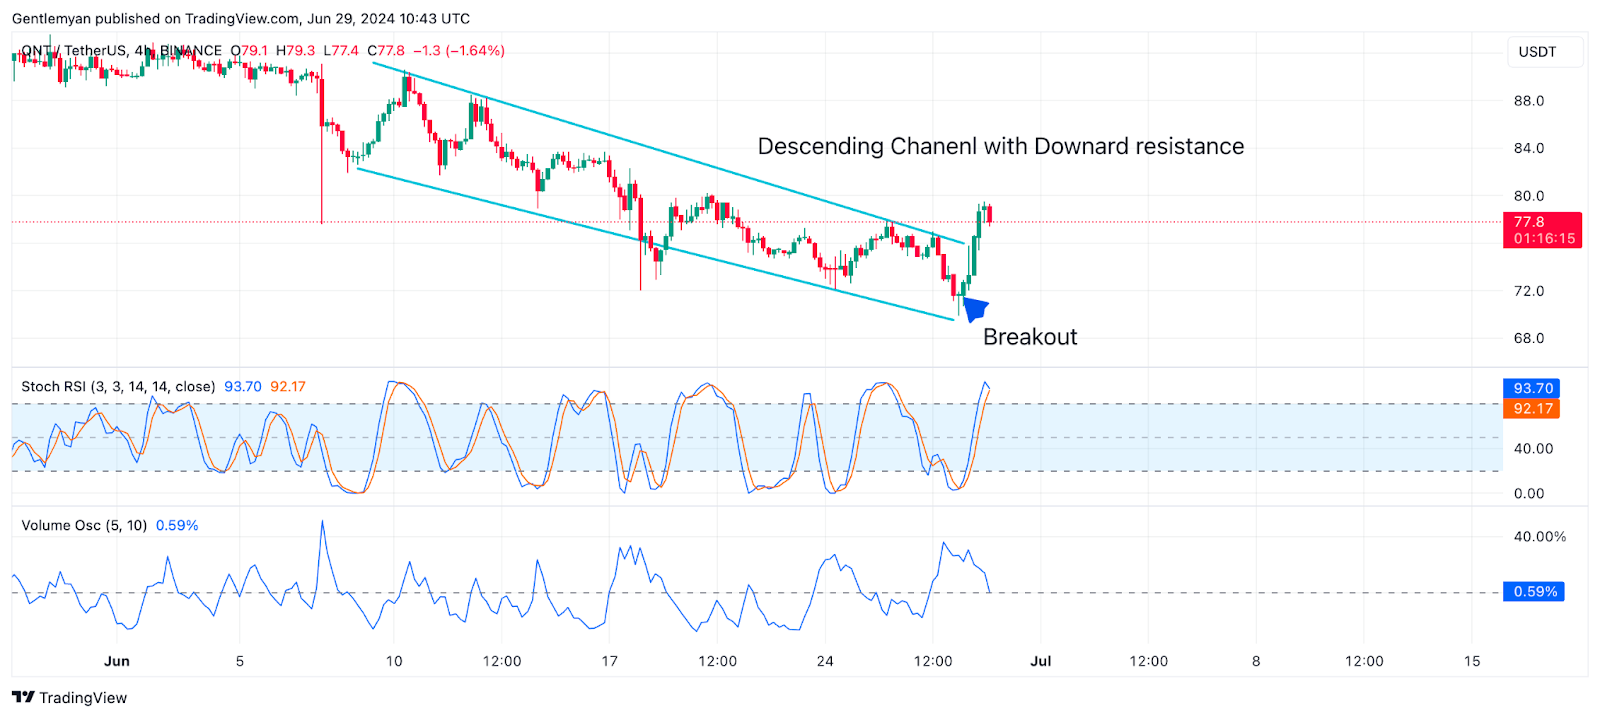
The Chart analysis of QNT/USDT of 4 hr frame shows a weak trend in the place for the pair. QNT price was seen fighting the EMA2O resistance of $79.5 but was rejected. The Stochastic RSI shows the price in overbought areas that may result in a reversal.
Moving below all the long-term and short-term moving averages, QNT will need to breach above $82 zone, the short-term EMA, and SMA. This price action wil create strong support zones. If the corrections continue to push the price below $70, we can see a drastic sell-off.
MOG Coin (MOG): Bullish
Stands out be a strong contender for a meme coin rally, MOG currently trading at $0.00000193 has increased 10% in 24 hours, and 104% in the last 7 days. This comes after Mog’s activity on the platform to improve the token utility.
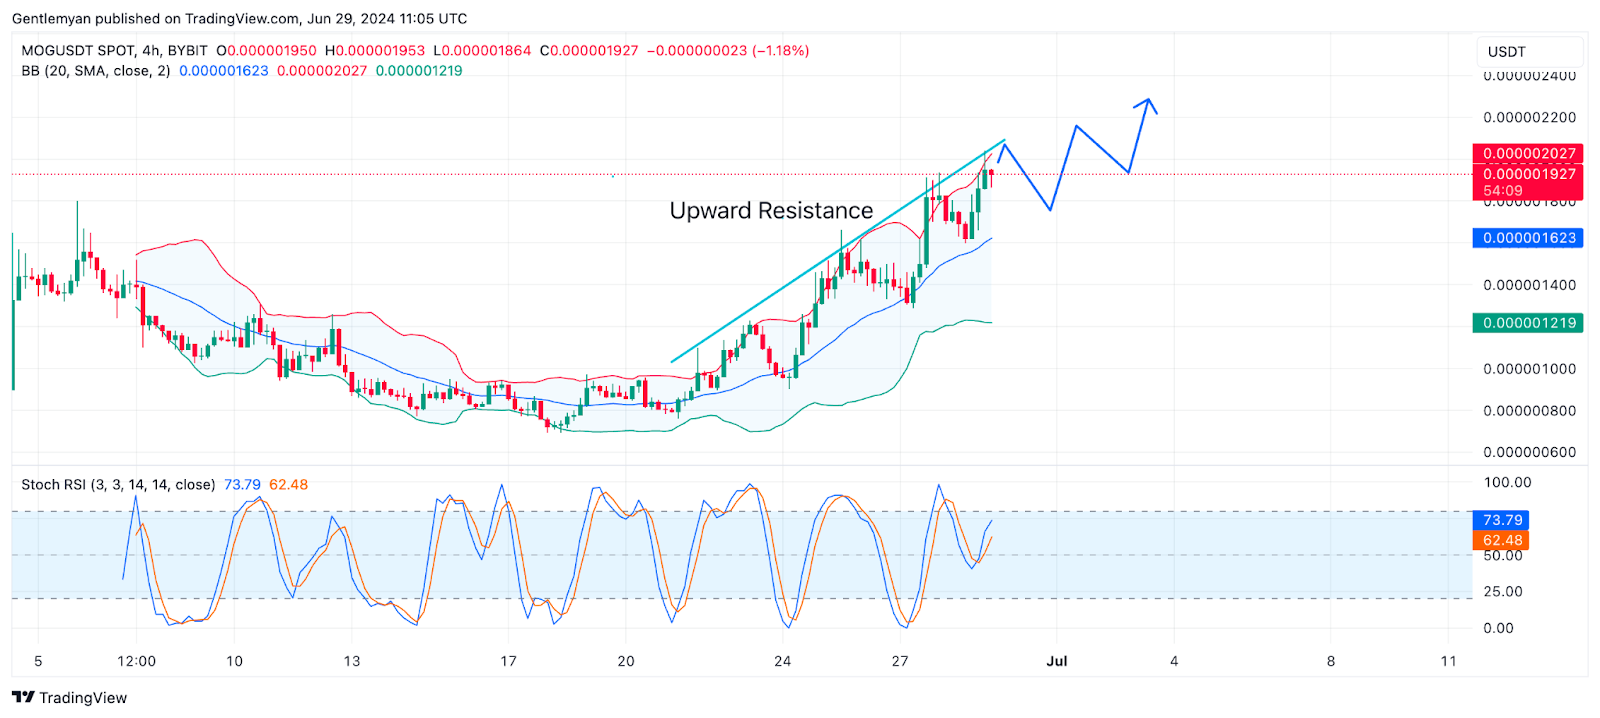
The MOG/USDT Chart shows the continued bullish trend for the crypto, the price plots a robust upward-moving channel and upward resistance. Applied Bollinger bands indicator reveals the price trading away from the center line and on the upside, also, the width of bands suggests a decreasing volatility.
The Stochastic RSI is approaching to an overbought zone, indicating the chart will create more corrective and pull-back mountains ahead.
POPCAT SOl ( POPCAT): Bullish At Watch
Popcat as presented in my previous analysis was the only performing Solana-based meme coins. In the last 2 Days, POPCAT Price has passed the strong resistance at $0.52 and flipped into a strong support zone with a reversal today.
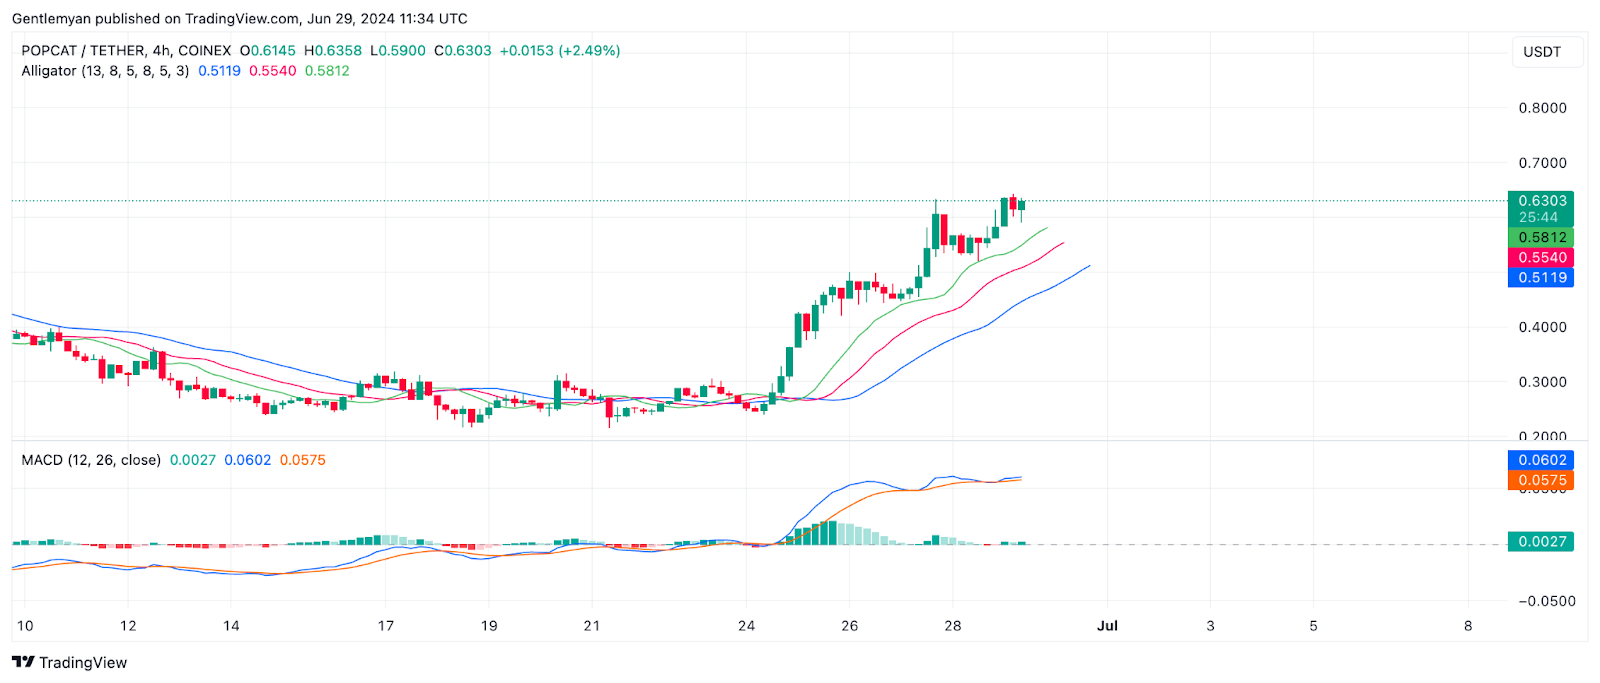
Moreover, the POPCAT price moving above all moving averages with MACD too high above the center line shows a bullish sentiment. The meme coin has breached multiple resistance levels.
Looking at the Alligator indicator, the green line is above the red and blue indicating an open bullish signal. If the market keeps favoring, POPCAT will hit the next renaissance at a time of $0.72, under the influence of meme coins.