The post Top Meme Coins To Start A Breakout Rally If Market Recovers! appeared first on Coinpedia Fintech News
With the growing volatility in the crypto market, meme coins are struggling to make a bullish comeback. While many have surpassed critical resistance levels, the lack of momentum keeps the prices stuck at lower levels.
Will a broader market recovery propel these meme coins for a moonshot rally this week? Read our price analysis below to find out!
Meme Coins Awaiting Breakout Rally:
Dogwifhat (WIF)
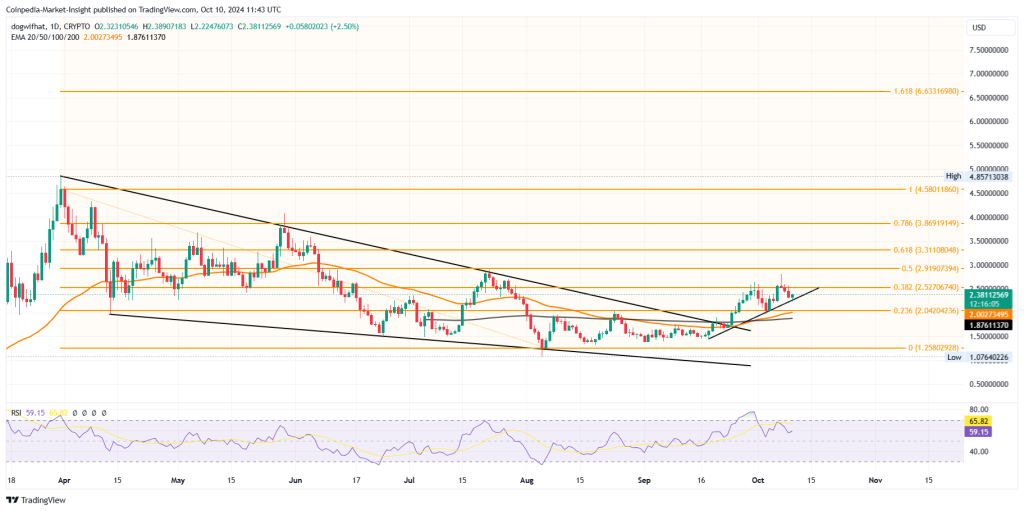
With a bullish breakout of a falling wedge pattern, the WIF price trend shows a surge in bullish momentum. Further, the higher high trend formation shows a recovery rally at play.

The WIF price trend shows a local support trendline forming to hold the uptrend intact. Further, the bullish trend in 50D and 200D EMA are gaining space after the recent golden crossover.
Currently, the breakout run in WIF price challenges the 38.20% Fibonacci level at $2.52. A bullish breakout will likely push the meme coin to the 61.80% level at $3.31 this week.
Floki
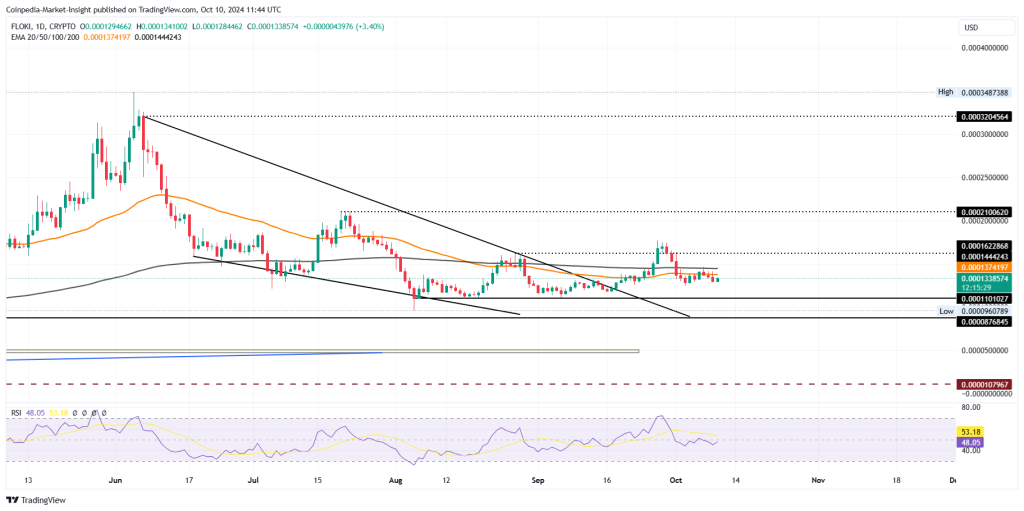
With a bullish breakout of a falling channel pattern, the FLOKI price surpasses the overhead trendline. However, the breakout run fails to gain momentum, resulting in a sideways trend.

The sideways trend in the FLOKI fails to surpass the 50D and 200D EMA below the $0.00014 level. Based on the price action analysis, the breakout rally must surpass the $0.00017 mark for a decisive uptrend.
The overhead resistance levels for the meme coin are at $0.00021 and $0.00032.
Curious if the FLOKI meme coin will create a new all-time high? Find out now in Coinpedia’s in-depth FLOKI price prediction for 2024 to 2030.
BONK
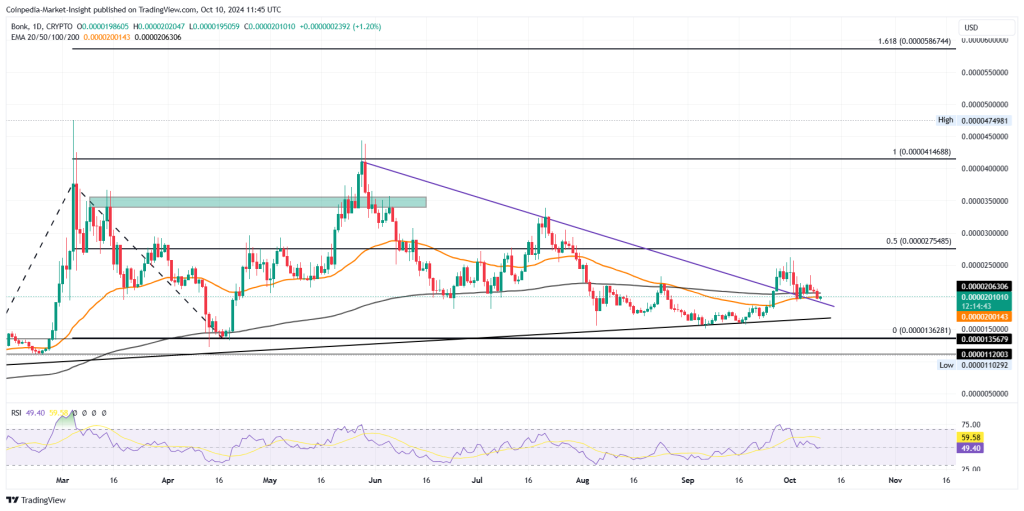
With a bullish conclusion to the lower high trend formation, BONK price action shows a breakout event. However, the uptrend fails to lift off from the crucial EMAs amid the broader market pullback.

Due to the bullish slowdown, the golden crossover in 50D and 200D EMA is delayed as the meme coin takes support over the dynamic lines. Further, the pullback comes as the retest of the trendline breakout.
Based on the price action analysis and Fibonacci levels, a bullish reversal will put $0.0023 and $0.0033 as the next potential price targets.


