The post What Happened to Bitcoin Today? Update 23 September 2024 appeared first on Coinpedia Fintech News
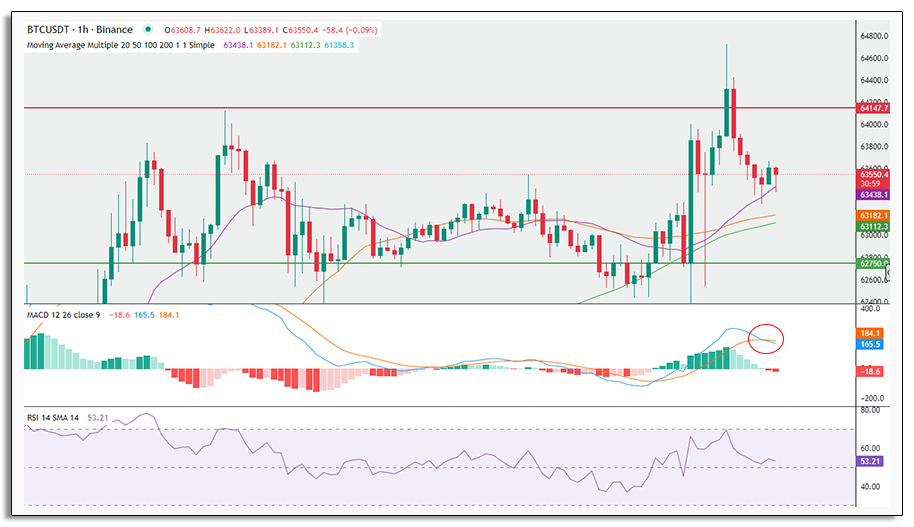
For the last 12 hours, Bitcoin has been messing with the trader on a deep level. BTC was trading at $63,330 when a fresh resistance hit hard pushing it back to $62,750. The next hour Bitcoin charged like a bull and broke this resistance to reach $63,800 which is a good point to rest. Traders were in speculation of a price fall due to resistance but that did not happen. When the market sentiment shifted for a consolidation, Bitcoin took everyone by surprise and like a two faced katana, liquidated $169 million worth of longs and shorts. Let’s understand what charts are trying to tell us.
A Big zone of Resistance
Bitcoin is under heavy fire from the resistance at the $64,000 zone as we discussed in a previous article. This resistance belongs to the 2021 bull run when Bitcoin made its All Time High here. What does this mean? In simple terms, there are people who have purchased Bitcoin at the peak and they are looking for a way to exit. Retail investors are afraid to make any purchases near heavy resistances which causes an asset to lose confidence in such areas. Same thing is happening with BTC here.

Bitcoin has attempted to cross this zone just 3 days prior causing it to fall for the nearest support at $62,750. This particular zone helped it rise again and after 2 more tries and rejections, Bitcoin actually succeeded in crossing it. However, this is not as simple as it looks. The zone between $64,000 and $69,000 is like a war zone due to the presence of two past ATHs. It would require immense bullish power to flag the victory. The largest cryptocurrency is trading at $63,555 at this moment and getting support from moving average 20.
The drop in btc price from $64,700 in the previous five hours reflects the exhaustion of buyers. The RSI has fallen from 69 points to 52. The MACD indicator is also pointing towards seller power increasing as the Signal line has taken over the MACD line.
Liquidation Data
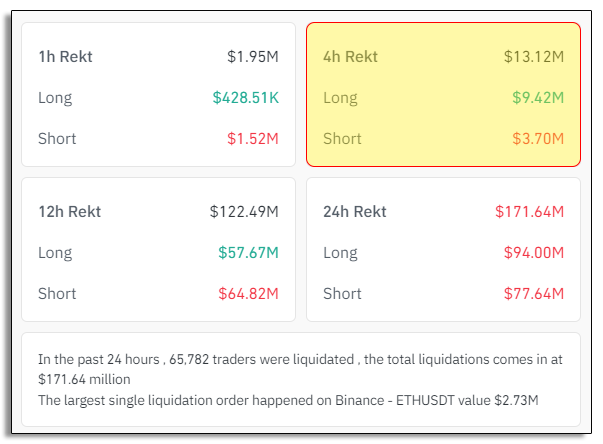
The 24 hours liquidation data shows that a total of $171.64 millions worth of Bitcoin trades were liquidated. Let’s just focus on the liquidation data for the last four hours. $9.42 m was liquidated for longs and one third of it, i.e. $3.70m was liquidated in shorts. In the last 24 hours, 65,782 traders were liquidated by the market. Reason for this liquidation? In delegate situations like this when Bitcoin is fighting with an ATH, it is very difficult to predict which way it will go.

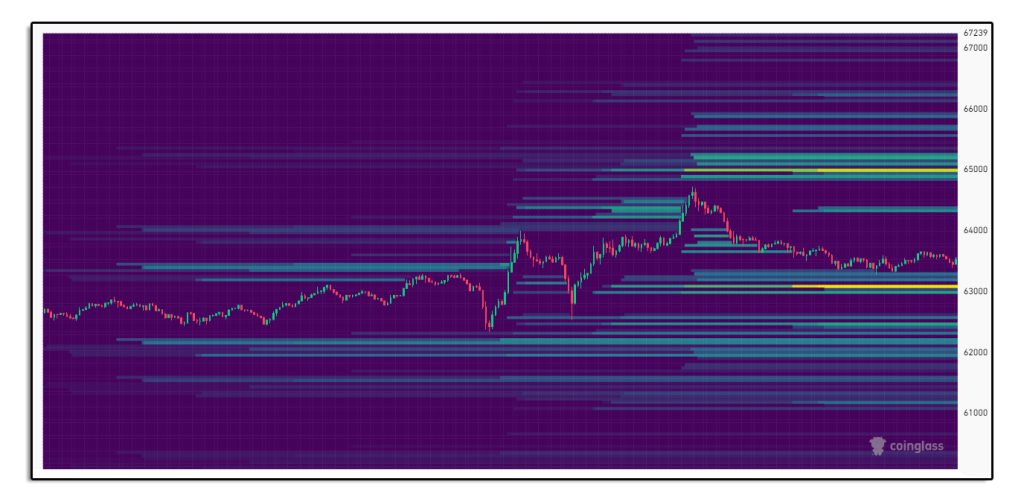
The liquidation heat map shows that there is a lack of liquidity from the current price till $64,600. To push the price towards the $65,000 zone the market would require a high buying pressure. Another 7 days left of September and there are chances traders would not want to pursue this mission before the next month.

What to Expect?
Indeed there are chances that bitcoin will try another attempt to break past the $64,000 price range as this will help the asset to climb to the next resistance as October starts. But we should also keep in mind that the current resistance is built in a bull run and has a strong base. It might require multiple attempts or investors taking risk and pushing with high buy volume. There are more chances of Bitcoin dropping down to $62,750 to retest and reinforce this support zone.


