The post Will CAKE Price Regain $3 By November End? appeared first on Coinpedia Fintech News
Amid the current market uncertainty in the crypto market, the bullish momentum in CAKE Price has started to wane around the $2.83 mark. The overhead supply is highlighted by long-wick rejection candles, Indicating the sellers may attempt to trigger a minor correction before the recovery rally continues.
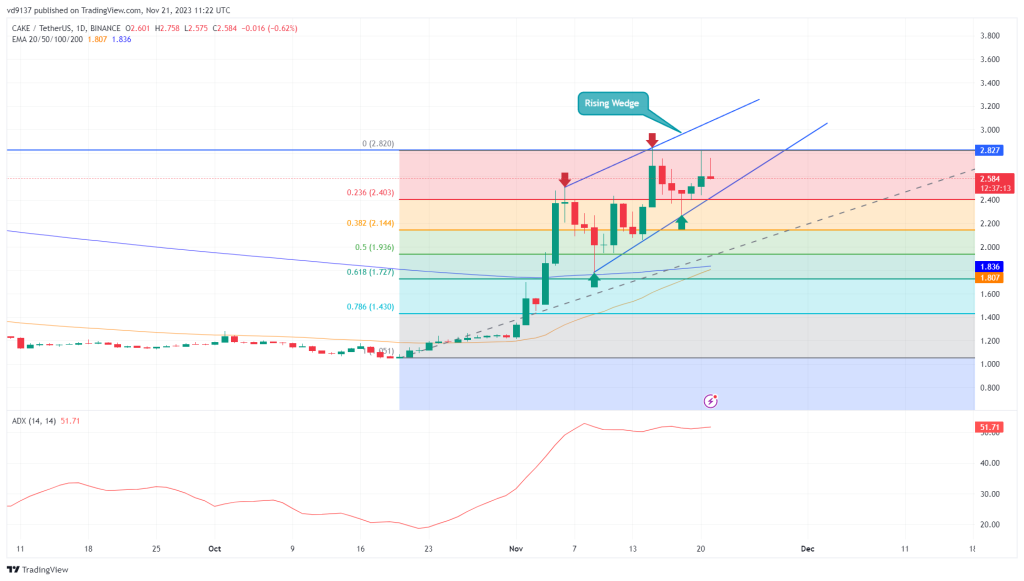
However, a look at the 4-hour time frame chart shows the overall recovery trend is still intact under the influence of a rising wedge pattern, indicating the Cake price prediction is bullish for the near term.
Chart Pattern Keep Recovery Intact

Source- Tradingview
The PancakeSwap token entered an aggressive recovery mode in the third week of October as the price jumped from $1.05 to a recent high of $2.82, accounting for a total growth of 169%. This recovery aligned with a significant surge in volume and several pullbacks indicate sustainable bullish growth.
Furthermore, the 4-hour chart shows this recovery has started shaping into a rising wedge pattern While converging trend lines offer dynamic support and resistance. A recent reversal from the lower trendline of the wedge pattern has pushed the Cake token to the current trading price of $2.6.
If the bullish momentum persists within this structure, buyers may prolong this rally 20% higher to hit the $3.15 mark. Anyhow, a breakout above the overhead trendline would accelerate the buying momentum and push the cake token price to a potential target of $3.5 followed by $4.
Technical Indicators:
EMA: A golden crossover between the 50 and 200 days would boast buying pressure in this asset
ADX indicator: The daily ADX slope at 51% accentuates an exhausted recovery and higher potential for correction.
Will the CAKE Price Fall Back Below $2?
Until the rising wedge pattern is intact, the CAKE token price may prolong its upward trajectory. However, taking a pessimistic approach, a bearish breakdown below this lower boundary provides sellers with additional barriers to pressurize the coin recovery.
The post-breakdown fall would tumble the prices 30% down to retest the $1.8 support concluding with the 61.8% Fibonacci retracement level.


