The post XRP Price Fall: Is 23.60% Fibonacci Level a Reversal Spot? appeared first on Coinpedia Fintech News
Despite the sudden recovery in major altcoins, the XRP price action reveals a struggling bullish attempt at a recovery rally. The altcoin is currently trading at $0.5131, with a 0.29% drop in the past 24 hours.
The XRP price has dropped by 3.83% in the past 30 days and struggles to sustain dominance above the $0.50 psychological mark. Amid the increasing market volatility, will the XRP price find a bullish route back to the $1.00 psychological mark?
XRP Tests 23.60% Fibonacci Level After Triangle Breakdown
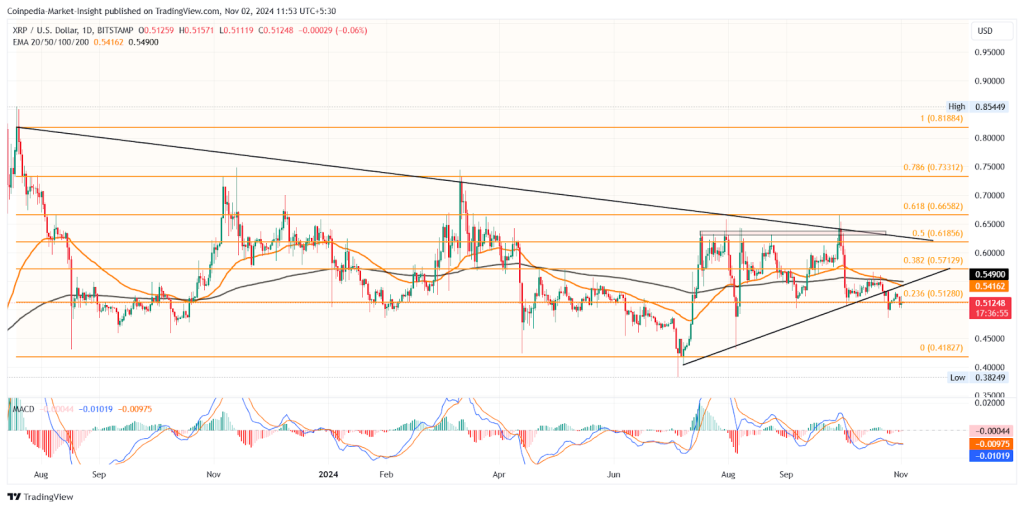
In the daily chart, the XRP price action shows a bearish breakdown below the local support trend line. This marks the bearish outcome of a symmetrical triangle pattern.

Furthermore, this puts the 23.60% Fibonacci level at $0.5128 at risk. Projecting the possibility of a minor recovery for XRP, the Doji candle found yesterday teases a Morningstar pattern.
If a morning star pattern acts as a bullish reversal pattern, XRP price could retest the broken support trend line. Furthermore, the formation of this pattern near the 23.60% Fibonacci support level will increase the chances of a bullish recovery.
Technical Indicators:
EMA: The increased bearish influence has resulted in a death cross event between the 50-day and 200-day EMA.
MACD: The MACD indicator shows a declining trend in the MACD and signal line as the supply pressure grows. Hence, technical indicators oppose the chances of a bullish recovery.
Will XRP Price Fall Under $0.50?
Based on the Fibonacci retracement tool and the price action analysis, a recovery rally with a broad market bull run will likely challenge the 50% Fibonacci level at $0.6185 or $0.7331. On the flip side, the crucial support remains at the $0.50 psychological mark and $0.45 mark.
Worried about the XRP price in the long run? Read Coinpedia’s Ripple (XRP) Price Prediction for 2024-2030 and subscribe to us for the latest crypto updates.


